Showing posts with label Guy McPherson. Show all posts

Friday, March 22, 2024

Atlantic ocean heat threatens to unleash methane eruptions

The image below shows that the monthly Atlantic surface temperature anomaly in February 2024 was 1.176°C when compared to a 1951-1980 base.

[ click on images to enlarge ]

The image below shows that the monthly Atlantic surface temperature anomaly in February 2024 was 1.435°C when compared to a 1901-2000 base. 


The difference illustrates the importance of selecting a base to calculate anomalies from. The anomaly indicates how much heat has accumulated in the Atlantic, and it is even larger for February 2024 when using a genuinely pre-industrial base, as discussed earlier.

The images also highlight the potential for the slowing down of the Atlantic meridional overturning circulation (AMOC) to contribute to more heat accumulating at the surface of the Atlantic Ocean.

As temperatures rise, many feedbacks are kicking in with greater ferocity, including increased stratification of oceans, loss of sea ice, loss of reflectivity of clouds and increased freshwater due to stronger melting of sea ice and glacial ice, due to heavier runoff from land and rivers and due to changes in ocean circulation.

While this may look to cause less ocean heat to reach the Arctic Ocean at the moment, the result is that a huge amount of ocean heat is accumulating in the North Atlantic that threatens to abruptly move into the Arctic Ocean. The danger is that an influx of ocean heat can cause large amounts of methane to erupt from the seafloor of the Arctic Ocean. 

The inset on the top image illustrates that, as people's emissions raise the temperature, this rise can strengthen wind, evaporation, ocean currents and rainfall locally, resulting in greater potential for a lid to form and spread at the surface of the North Atlantic. As temperatures rise and winds strengthen, more evaporation can occur in one place and more rain can then fall further down the path of the Gulf Stream, i.e. an ocean current that extends into the Arctic Ocean, as part of AMOC. This rain further contributes to the freshwater accumulation at the surface of the North Atlantic.

In the video below, Guy McPherson discusses a recent study by Marilena Oltmanns et al. on some of these issues.


This page further discusses formation of a cool freshwater lid at the surface of the North Atlantic and the contribution to this of Jet Stream changes. The image below shows that the Jet Stream reached speeds as high as 455 km/h or 283 mph north of Washington on February 18, 2024 03:00 UTC, with Instantaneous Wind Power Density as high as 387.5 kW/m².

From earlier post Blue Ocean Event 2024?

A huge amount of ocean heat is accumulating in the North Atlantic and threatens to abruptly move into the Arctic Ocean. The danger is that, due to strong wind along the path of the Gulf Stream, huge amounts of ocean heat will abruptly get pushed into the Arctic Ocean, with the influx of ocean heat causing destabilization of hydrates contained in sediments at the seafloor of the Arctic Ocean, resulting in eruptions of huge amounts of methane. 

Strong hurricanes can significantly add to the danger. More hurricanes are forecast for the 2024 Atlantic hurricane season than during 1950-2020, as illustrated by the image below. 


Many of the dangers have been discussed before, e.g. the danger that sea currents in the Arctic Ocean will change direction, in this 2017 post

Arctic sea ice thickness warning

The compilation image below shows Arctic sea ice on March 28, 2024. The satellite image (left) may indicate extensive sea ice, but clouds can obscure things. The other image (right) indicates that sea ice in a large area from the Laptev Sea down to the North Pole may be very thin.


The image below illustrates the decline of Arctic sea ice volume over the years.


The images above and below show that Arctic sea ice volume has recently been the lowest on record for the time of year.


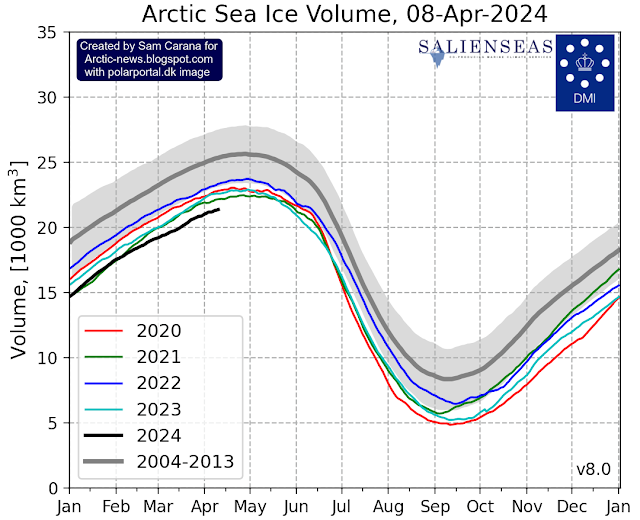
Given that Arctic sea ice currently is still relatively extensive, this low volume indicates that sea ice is indeed very thin, which must be caused by ocean heat melting sea ice from below, since little or no sunshine is yet reaching the Arctic at the moment and air temperatures are still far below freezing point, so where ocean heat may be melting sea ice away from below, a thin layer of ice will quickly be reestablished at the surface. 

This situation looks set to dramatically change over the next few months, as air temperatures will rise and as more ocean heat will reach the Arctic Ocean. Moreover, as illustrated by the map below, much of the thicker sea ice is located off the east coast of Greenland. This sea ice and the purple-colored sea ice can be expected to melt away quickly with the upcoming rise in temperatures over the next few months.


Climate Emergency Declaration

The situation is dire and the precautionary principle calls for rapid, comprehensive and effective action to reduce the damage and to improve the situation, as described in this 2022 post, where needed in combination with a Climate Emergency Declaration, as discussed at this group.


Links

• Climate Reanalyzer

• Pre-industrial
https://arctic-news.blogspot.com/p/pre-industrial.html

• Cold freshwater lid on North Atlantic
https://arctic-news.blogspot.com/p/cold-freshwater-lid-on-north-atlantic.html

• European summer weather linked to North Atlantic freshwater anomalies in preceding years - by Marilena Oltmanns et al.
https://wcd.copernicus.org/articles/5/109/2024/wcd-5-109-2024-discussion.html
discussed at facebook at: 
https://www.facebook.com/groups/arcticnews/posts/10161330866254679

• Science Snippets: Arctic Sea Ice Affects European Summers, Marine Life, and All Life on Earth - by Guy McPherson
https://www.youtube.com/watch?v=X09vtWNDuDw

• nullschool 
https://earth.nullschool.net

• Jet Stream
https://arctic-news.blogspot.com/p/jet-stream.html

• Extended range forecast of Atlantic seasonal hurricane activity and landfall strike probability for 2024 - by Philip Klotzbach et al.
https://tropical.colostate.edu/forecasting.html
discussed on facebook at:
https://www.facebook.com/groups/arcticnews/posts/10161346323759679

• Arctic Ocean Feedbacks
https://arctic-news.blogspot.com/2017/01/arctic-ocean-feedbacks.html

• NASA Worldview satellite images
https://worldview.earthdata.nasa.gov

• University of Bremen - Arctic sea ice
https://seaice.uni-bremen.de/start

• Danish Meteorological Institute - Arctic sea ice volume and thickness


Friday, October 13, 2023

Temperature rise - September 2023 and beyond

The above image, adapted from NASA and the image below, adapted from Climate Reanalyzer and using the same baseline, illustrate the September 2023 temperature anomaly.


September 2023 was the month with the highest temperature anomaly on record. What contributed to this?

El Niño
 

The temperature rose about 0.5°C from November 2022 to March 2023, and this occurred at a time when we were not even in an El Niño yet, as illustrated by the above image, from an earlier post. Below is an updated image, from January 1950 to September 2023, adapted from NOAA

[ click on images to enlarge ]
[ click on images to enlarge ]
The current El Niño is still strengthening, as illustrated by the image on the right, adapted from IRI.

Further contributors

There are further reasons why the temperature can be expected to keep rising beyond September 2023.

The number of sunspots has been higher than predicted and looks set to keep rising above predicted levels until July 2025, as discussed here.

The eruption of the submarine volcano near Tonga in January 2022 caused a lot of water vapor to reach high up into the atmosphere and this may still contribute to the temperature rise, as discussed here.

Aerosols that have a cooling effect, such as dust and sulfates (SO₄), are also important. As fossil fuel is burned, sulfates are co-emitted. Since they pollute the air, measures have been taken and are being taken to reduce them, e.g. in shipping, and this has pushed up the temperature rise. Meanwhile, cooling aerosols such as sulfates are still high. As illustrated by the image below, adapted from nullschool.net, SO₄ was as high as 8.621 τ at the green circle on October 6, 2023, at 07:00 UTC. In future, SO₄ could fall dramatically, e.g. in case of a sudden economic collapse, reducing the aerosol masking effect rapidly and abruptly causing a substantial rise in temperature.


After little change in the Antarctic sea ice extent graph for decades, extent loss was dramatic in 2022 and even more dramatic in 2023, as less and less sunlight was getting reflected back into space and instead was getting absorbed by the water of the Southern Ocean, as illustrated by the image below, adapted from NSIDC.
Sea ice retreat comes with loss of albedo, i.e. loss of the amount of sunlight reflected back into space, resulting in more heat getting absorbed in the Southern Ocean, making it a self-reinforcing feedback loop. Clouds constitute another self-reinforcing feedback loop; a warmer Southern Ocean comes with fewer bright clouds, further reducing albedo, as discussed here and here. For decades, there still were many lower clouds over the Southern Ocean, reflecting much sunlight back into space, but these lower clouds have been decreasing over time, further speeding up the amount of sunlight getting absorbed by the water of the Southern Ocean, and this 'pattern effect' could make a huge difference globally, as a recent study points out. Emissivity is a further factor; open oceans are less efficient than sea ice when it comes to emitting in the far-infrared region of the spectrum (feedback #23 on the feedbacks page). 


The above image was created by Zach Labe with NSIDC data (Arctic + Antarctic) for each year from 1979 to 2023 (satellite-era; NSIDC, DMSP SSM/I-SSMIS). The image illustrates that global sea ice extent  recently reached the largest anomaly in the satellite record. Anomalies are calculated using a 5-day running mean from a climatological baseline of 1981-2010. 2016 is shown with a yellow line. 2023 is shown using a red line (updated 10/16/2023).

In the video below, Paul Beckwith discusses the importance of loss of sea ice at around -60° (South).


As said, there are many factors behind the temperature increase around latitude -60° (South). As Paul mentions, this latitude receives a lot of sunlight around the year. Therefore, it is not surprising that, as oceans continue to heat up, there is huge loss of sea ice at this latitude, as well as loss of lower clouds, while open oceans are additionally less efficient than sea ice when it comes to emitting in the far-infrared region of the spectrum. The image below, adapted from NASA, shows a white band around -60° (South), indicating that the Southern Ocean has long been colder there than elsewhere, but has recently started to catch up with the global temperature rise.


The above image also illustrates that anomalies are highest in the Arctic, narrowing the temperature difference between the Arctic and the Tropics, with the air flow slowing down accordingly. 

[ image adapted from Copernicus ]
This in turn changes the Jet Stream and the Polar Vortex, resulting in blocking patterns that can, in combination with rising temperatures, strongly increase the frequency, intensity, duration and area coverage of extreme weather events such as storms and lightning, heatwaves and forest fires.

Forest fires in Canada have been releasing massive amounts of emissions that push up the temperature, including greenhouse gases such as carbon dioxide, warming aerosols such as black carbon & brown carbon and NMVOC (non-methane volatile organic carbon) and carbon monoxide that reduce the availability of hydroxyl, resulting in more methane and ozone in the atmosphere. 

[ NH sea surface temperature anomaly ]
At the same time, slowing down of the Atlantic Meridional Ocean Current (AMOC) can result in more ocean heat accumulating at the surface of the North Atlantic, as illustrated by the image on the right, from an earlier post.

As temperatures rise, increased meltwater runoff from Greenland and more icebergs moving south, in combination with stronger ocean stratification and stronger storms over the North Atlantic, can also cause a freshwater lid to form at the surface of North Atlantic that can at times enable a lot of hot water to get pushed abruptly underneath this lid toward the Arctic Ocean. The danger is that more heat will reach the seafloor and destabilize methane hydrates contained in sediments at the seafloor of the Arctic ocean. 

Ominously, very high methane levels continue to be recorded at Barrow, Alaska, as illustrated by the image below, adapted from NOAA.

The next few months will be critical as Arctic sea ice is sealing off the Arctic Ocean from the atmosphere, trapping heat underneath the ice and making it harder for ocean heat to get transferred from the Arctic Ocean to the atmosphere above the Arctic. Furthermore, sea ice is very thin, reducing the latent heat buffer that could otherwise have consumed ocean heat. 

The next danger is that the thin Arctic sea ice will rapidly retreat early next year as a warming Arctic Ocean will transfer more heat to the atmosphere over the Arctic, resulting in more rain and more clouds in the atmosphere over the Arctic, speeding up sea ice loss and further pushing up the temperature rise over the Arctic, as discussed at the feedbacks page, which also discusses how less Arctic sea ice can push up temperatures through the emissivity feedback. As temperatures rise over the Arctic, permafrost on land also threatens to thaw faster, threatening to cause huge releases of greenhouse gases, including carbon dioxide, methane and nitrous oxide. 


Meanwhile, emissions of greenhouse gases keep rising, further pushing up the temperature, as illustrated by the image below, from an earlier post.
  
Global energy-related greenhouse gas emissions 2000-2022, adapted from EIA ]
In the video below, Guy McPherson describes how temperature rise, loss of habitat and meltdown of nuclear power facilities each could result in rapid extinction of humans and many other species.


There are numerous further feedbacks that can accelerate the temperature rise and tipping points that can get crossed and cause even more abrupt rise of the temperature. One of these is the clouds tipping point that in itself can cause a temperature rise of 8°C, as discussed here.

Further feedbacks are also discussed at the Extinction page.  One further feedback is water vapor. A warmer atmosphere holds more water vapor, at a rate of 7% for each Degree Celsius the temperature rises. As temperatures keep rising, ever more water vapor will be sucked up by the atmosphere. This will also cause more droughts, reducing the ability of land to sustain vegetation and provide soil cooling through shading and through evaporation and formation of lower clouds, as discussed here. More water vapor in the atmosphere will also speed up the temperature rise because water vapor is a potent greenhouse gas.

The fact that such tipping points and feedbacks occur as greenhouse gas levels reach certain levels and as the temperature rise makes it critical to assess how fast greenhouse gas levels could rise and by how much the temperature has already risen. 

NASA data up through September 2023

The image below, adapted from NASA, shows that the September 2023 NASA Land+Ocean temperature was 1.78°C higher than it was in September 1923. The anomaly is 1.74°C when compared to a base centered around the year 1900 (1885-1915). The 1.74°C anomaly can be adjusted by 0.99°C to reflect a pre-industrial base, air temperature and higher polar anomalies (as shown in the box on the bottom right of the image), adding up to a potential anomaly of 2.73°C. 

[ click on images to enlarge ]
Indeed, earlier analysis such as discussed here, points out that the temperature may already have risen by more than 2°C (compared to pre-industrial) in 2015, when politicians pledged at the Paris Agreement to take action to combat the temperature rise to prevent this from happening. 

Blue: Polynomial trend based on Jan.1880-Sep.2023 data. 
Magenta: Polynomial trend based on Jan.2010-Sep.2023 data.
The above image is created with NASA Land+Ocean monthly mean global temperature anomalies vs 1885-1915, adjusted by 0.99°C to reflect ocean air temperature, higher polar anomalies and a pre-industrial base, and has trends added.  

Alarms bells have been sounding loud and clear for a long time, as discussed in posts such as this one, warning that the temperature could rise by more than 3°C by 2026. The above magenta graph shows how this could occur as early as next year (end 2024).

[ image from earlier post ]
[ image from the Extinction page ]
The above image illustrates the latent heat tipping point - estimated to correspond with a sea surface temperature anomaly of 1°C above the long term average (1901-1930 on the above image) - to get crossed and the seafloor methane tipping point - estimated to correspond with a sea surface temperature anomaly of 1.35°C - to get reached, as discussed in earlier posts such as this one, .

A Blue Ocean Event could occur as the latent heat and seafloor methane tipping points get crossed, and the ocean temperature keeps rising, as huge amounts of methane get released in the Arctic, as ever more heat keeps reaching and destabilizing methane hydrates contained in sediments at the seafloor of the Arctic Ocean, as discussed in many earlier posts such as this one.

Seafloor methane is one of many elements that could jointly cause a temperature rise of over 10°C, in the process causing the clouds tipping point to get crossed that can push up the temperature rise by a further 8°C, as illustrated by the image on the right, from the extinction page.

Conclusion

The precautionary principle should prevail and the looming dangers should prompt people into demanding comprehensive and effective action to reduce the damage and to improve the situation. 

To combat rising temperatures, a transformation of society should be undertaken, along the lines of this 2022 post in combination with a declaration of a climate emergency.


Links

• NASA - global maps

• NOAA - ENSO and Temperature bars

• The International Research Institute for Climate and Society, Columbia University Climate School
https://iri.columbia.edu/our-expertise/climate/forecasts/enso/current/?enso_tab=enso-sst_table

• Nullschool.net

• NSIDC - sea ice graph

• Zach Labe - Global sea ice - extent, concentration, etc.

• NASA - zonal means
https://data.giss.nasa.gov/gistemp/zonal_means

• Copernicus - Northern Hemisphere wildfires: A summer of extremes
https://atmosphere.copernicus.eu/northern-hemisphere-wildfires-summer-extremes

• NOAA - Barrow Atmospheric Baseline Observatory, United States
https://gml.noaa.gov/dv/iadv/graph.php?code=BRW&program=ccgg&type=ts

• Paul Beckwith - Accelerated Global Warming from Antarctic Sea Ice Collapse: Albedo, Latitude, Snow Cover on Ice…
https://www.youtube.com/watch?v=-5P1W4TrczQ

• Guy McPherson - College of Complexes Presentation (with Improved Audio) 

• NASA custom plots
https://data.giss.nasa.gov/gistemp/graphs_v4/customize.html

• Transforming Society


Sunday, August 20, 2023

High Wet Bulb Globe Temperatures hit the US again

Temperatures are high

Globally, temperatures have been at record high levels for the time of year for some time in 2023, as illustrated by the image below, adapted from Climate Reanalyzer. 


On August 25, 2023, the world temperature was 16.99°C, 0.94°C higher than it was on that day in 1979-2000. 

Extreme heat stress alert

High Wet Bulb Globe Temperatures hit the U.S. over a large area, over a long time. 

Wet Bulb Globe Temperatures were forecast to be as high as 95°F or 35°C in Lufkin, Texas, on Monday August 21, 2023 at 4 am Central Time.

Wet Bulb Globe Temperatures as high as 35°C were also forecast to be reached in Topeka, Kansas on the same day and at the same time, as illustrated by the image below.


The image below shows forecasts for August 24, 2023, measured as temperature (left), apparent temperature (center) and wet bulb globe temperature (right), three areas with high values marked by squares, circles, and stars, respectively.  


For descriptions of the various ways temperature can be measures, also see the earlier post Extreme Heat Stress

Unbearable conditions

The images further illustrate that, as temperatures rise, conditions are increasingly occurring that make it hard, if not impossible for many species (including humans) to survive, even at relatively high latitudes. This danger has been discussed in many earlier posts, such as in Humans may be extinct in 2026 and Two Tipping Points

In the video below, Guy McPherson gives his views on the situation.


Conclusion

The situation is dire and is getting more dire every day, which calls for a Climate Emergency Declaration and implementation of comprehensive and effective action, as described in the Climate Plan with an update at Transforming Society.

Links

• Climate Reanalyzer - Daily 2-meter Air Temperature
https://climatereanalyzer.org/clim/t2_daily

• Wet Bulb Globe Temperature forecasts
https://digital.mdl.nws.noaa.gov

• Extreme Heat Stress
https://arctic-news.blogspot.com/2023/06/extreme-heat-stress.html

• National Weather Service - Wet Bulb Globe Temperature: How and when to use it
https://www.weather.gov/news/211009-WBGT

• Humans may be extinct in 2026

• Two Tipping Points


Tuesday, August 15, 2023

Two Tipping Points

The image below, adapted from Climate Reanalyzer, shows that the World Sea Surface Temperature (60°South - 60°North) was at a record high of 21.1°C or 69.98°F for the third day in a row on August 23, 2023. As the image also shows, sea surface temperatures over the past few months have been much higher for the time of year than in any other year on record. 

The image below shows why this recent sea surface temperature rise is so worrying. The image below is based on NASA data for monthly mean global surface temperature anomalies (open ocean) vs 1901-1930. The ochre trend, based on January 1900-July 2023 data, indicates that the latent heat tipping point was crossed in 2021 and the seafloor methane tipping point may be crossed by the end of 2033. Both trends extend into the future for 15 years, but the red trend is based on July 2008-July 2023 data and better reflects El Niño and other variables, and this red trend indicates that the latent heat tipping point was crossed in 2023 and the seafloor methane tipping point may be crossed later this year.

[ click on images to enlarge ]

Sea ice constitutes a latent heat buffer, consuming incoming heat as it melts. While the ice is melting, all energy (at 334 J/g) goes into changing ice into water and the temperature remains at 0°C (273.15K or 32 °F). Once all ice has turned into water, all subsequent energy goes into heating up the water, and will do so at 4.18 J/g for every 1°C the temperature of the water rises. 

[ sea ice thickness, from earlier post ]
Loss of this buffer is linked to subsequent destabilization of methane hydrates. So, there are two tipping points that are linked, and the latent heat tipping point gets crossed in the Arctic before the seafloor methane tipping point gets reached.

The situation is particularly precarious in the Arctic, as the North Atlantic Ocean is very hot and the Gulf Stream keeps pushing hot water toward the Arctic Ocean, while Arctic sea ice has become very thin. The image on the right, from Uni of Bremen, shows that on July 25, 2023, there was virtually no Arctic sea ice left that was more than 30 cm thick. 

The latent heat tipping point is the point where Arctic sea ice loss is such that further incoming ocean heat that was previously consumed as Arctic sea ice melted, instead gets absorbed by the Arctic Ocean. 

[ sea surface temperature anomaly ]
The image on the right, adapted from nullschool.net, shows that on August 2, 2023, most of the Arctic Ocean was showing surface temperatures above the daily average during 1981-2011, indicating that the latent heat tipping point was reached. The latent heat tipping point is estimated to correspond with an ocean temperature anomaly of 1°C above the long term average, 1901-1930 on the above image.

The image underneath, also from nullschool.net, shows the situation on August 20, 2023, when temperatures at the North Pole had been above zero for more than a day and temperatures were forecast to go below zero only twice briefly afterwards, for the period up to August 24, 2023 19:00 UTC (which is as far as the forecast went at the time. 

[ surface temperature ]
This is a further indication that the latent heat tipping point has been reached and that no more heat can be consumed by sea ice melting.

How much sea ice is left? What does the sea ice look like, near the North Pole? Satellite images can give a good impression, but clouds can obscure the view. A clearer view can be obtained by comparing images over several days. 

An animation can reveal how much, or rather how little sea ice is left, and to what extent water of the Arctic Ocean is visible. 

[ Satellite view, click on images to enlarge ]
The animation on the right is made with four NASA Worldview images, showing the situation on August 11, 15, 16 and 19, 2023. 

The second tipping point, the seafloor methane tipping point, occurs as more heat reaches the seafloor where it destabilizes hydrates contained in sediments at the seafloor.

This tipping point comes with multiple self-reinforcing feedback loops, such as explosive growth in methane volume setting off further destabilization, rapid rise of Arctic temperatures, loss of permafrost and loss of albedo, and release of further greenhouse gases.

Crossing of the seafloor methane tipping point will occur later than crossing of the latent heat tipping point, so the seafloor methane tipping point is estimated to correspond with a higher ocean temperature anomaly.

The current situation is particularly precarious in the Arctic, as the North Atlantic Ocean is very hot and the Gulf Stream keeps pushing hot water toward the Arctic Ocean, while Arctic sea ice has become very thin (image right) and the latent heat tipping point has been crossed.

As the temperature of the Arctic Ocean keeps rising, more heat can reach sediments located at the seafloor, since much of the Arctic Ocean is very shallow and sediments at the seafloor of the Arctic Ocean can contain vast amounts of methane.

The danger is that further heat will destabilize hydrates in these sediments, leading to explosive eruptions of methane, as its volume increases 160 to 180-fold when leaving the hydrates, and resulting in huge eruptions of methane both from the destabilizing hydrates and from methane that is present in the form of free gas underneath the hydrates.

[ from earlier post, click on images to enlarge ]

The above image, from an earlier post, illustrates that warnings have been given before about the danger of these two tipping points getting crossed in the Arctic. In the above image, the trends are based on annual sea surface temperature data for the Northern Hemisphere. The seafloor methane tipping point is estimated to get crossed when the ocean temperature anomaly on the Northern Hemisphere goes beyond 1.35°C above its long term average.

The Argo Float 7900549 compilation image below illustrates that the highest water temperatures in the Arctic Ocean can occur at a depth of approximately 100 meters. The image shows temperatures as high as 5°C at that altitude.


Stronger winds along the path of the Gulf Stream can at times speed up sea currents that travel underneath the surface. As a result, huge amounts of hot, salty water can travel from the Atlantic Ocean into the Arctic Ocean, abruptly pushing up temperatures and salinity levels at the bottom of the Arctic Ocean, which in many places is very shallow.


The above image shows details of Argo float 9701007, further illustrating the danger that heat can reach the seafloor. North of Norway, where the water is less than 400 m deep, temperatures higher than 5°C show up throughout the vertical water column, up to August 10, 2023, when temperatures above 11°C were recorded close to the sea surface. The colored inset also shows that greater mixing down of heat occurred from October to December 2022, as the sea ice started to return and seal off the surface, preventing heat transfer from ocean to atmosphere, as also discussed at FAQ #11.

Below is another image adapted from Climate Reanalyzer, showing that the sea surface temperature of the North Atlantic Ocean has for months been much higher for the time of year than it was in previous years on record. Eight causes behind this have been discussed in an earlier post. The image below shows the situation on August 28, 2023, with the North Atlantic sea surface temperature reaching a record high of 25.34°C or 77.61°F. 


The image below, adapted from NOAA, shows how the Gulf Stream is pushing ocean heat toward the Arctic Ocean, while sea surface temperatures show up as high as 33.6°C or 92.48°F on August 17, 2023. 


[ 2022 animation ]
Studies, some of them dating back more than two decades, show that over the shallow East Siberian Arctic Shelf (ESAS) winds at times can mix the water column from the top to the bottom. A 2005 study of the ESAS led by Igor Semiletov recorded water temperatures at the seafloor, in September 2000, of 4.7°C at 20m depth at one location and 2.11°C at 41m depth at another location, with salinity levels of 29.7‰ and of 31.7‰, respectively.

A deformed Jet Stream, in combination with a cyclone, could similarly result in strong winds abruptly pushing a huge amount of heat through the Bering Strait into the Arctic Ocean. 

The animation on the right shows how remnants of Typhoon Merbok were forecast to enter the Arctic Ocean through the Bering Strait from September 17 to 19, 2022.

The image below, adapted from Climate Reanalyzer, shows that the (2-meter) air temperature in the Arctic was 3.79°C on August 25, 2023, a record high for the time of year and 2.08°C higher than the 1979-2011 mean for that day.


The image below illustrates how incoming ocean heat that previously was consumed in the process of melting of the sea ice, is now causing the water of the Arctic Ocean to heat up, with more heat reaching the seafloor of the Arctic Ocean, which has seas that in many places are very shallow.

[ Latent heat loss, feedback #14 on the Feedbacks page ]
Further adding to the danger is that destabilization of methane hydrates can cause huge amounts of methane to erupt with great force in the form of plumes. Consequently, little of the methane can be broken down in the water by microbes, while there is very little hydroxyl in the atmosphere over the Arctic Ocean to break down the methane that enters the atmosphere.

Ominously, some very high methane levels were recorded recently at Barrow, Alaska, as illustrated by the NOAA images below.

The most recent monthly methane average recorded at Barrow, Alaska, is above 2080 parts per billion.

In the video below, Guy McPherson describes the dire situation.


Climate Emergency Declaration

A catastrophe of unimaginable proportions is unfolding. Life is disappearing from Earth and runaway heating could destroy all life. At 5°C heating, most life on Earth will have disappeared. When looking only at near-term human extinction, 3°C will likely suffice.

The situation is dire and is getting more dire every day, which calls for a Climate Emergency Declaration and implementation of comprehensive and effective action, as described in the Climate Plan with an update at Transforming Society.


Links

• Climate Reanalyzer - daily sea surface temperature
https://climatereanalyzer.org/clim/sst_daily

• Climate Reanalyzer - daily 2-meter air temperature
https://climatereanalyzer.org/clim/t2_daily

• NASA - GISS Surface Temperature Analysis
https://earth.nullschool.net

• NOAA - Barrow Atmospheric Baseline Observatory, United States
https://gml.noaa.gov/dv/iadv/graph.php?code=BRW&program=ccgg&type=ts

• Argo Float
https://fleetmonitoring.euro-argo.eu

• Remnants of Typhoon Merbok forecast to enter the Arctic Ocean through the Bering Strait from September 17 to 19, 2022.
Discussed at https://www.facebook.com/SamCarana/posts/10166948876390161, from:
https://arctic-news.blogspot.com/p/cold-freshwater-lid-on-north-atlantic.html

• The East Siberian Sea as a transition zone between Pacific-derived waters and Arctic shelf waters - by Igor Semiletov et al. (2005)
https://agupubs.onlinelibrary.wiley.com/doi/10.1029/2005GL022490

• Sea surface temperature at record high
https://arctic-news.blogspot.com/2023/03/sea-surface-temperature-at-record-high.html

• Record high North Atlantic sea surface temperature


Monday, July 31, 2023

Wet Bulb Globe Temperature Tipping Point

High Wet Bulb Globe Temperatures (WBGT) are forecast to hit Louisiana, United States, over the next few days. The image below shows a forecast for August 2, 2023, 18 UTC, with WBGT as high as 35°C forecast for a location 10 miles South East of Abbeville, Louisiana, U.S.


WBGT is a measure used by weather.gov to warn about expected heat stress when in direct sunlight. It takes into account the effect of temperature, relative humidity, wind speed, and solar radiation on humans.

As temperatures and humidity levels keep rising, a tipping point can be reached where the wind factor no longer matters, in the sense that wind can no longer provide cooling. The human body can cool itself by sweating, which has a physiological limit that was long described as a 35°C wet-bulb temperature. Once the wet-bulb temperature reaches 35°C, one can no longer lose heat by perspiration, even in strong wind, but instead one will start gaining heat from the air beyond a wet-bulb temperature of 35°C.

Accordingly, a 35°C wet-bulb temperature (equal to 95°F at 100% humidity or 115°F at 50% humidity) was long seen as the theoretical limit, the maximum a human could endure.

A 2020 study (by Raymond et al.) warns that this limit could be regularly exceeded with a temperature rise of less than 2.5°C (compared to pre-industrial). A 2018 study (by Strona & Bradshaw) indicates that most life on Earth will disappear with a 5°C rise. Humans, who depend for their survival on many other species, will likely go extinct with a 3°C rise, as illustrated by the image below, from an earlier post.


A 2022 study (by Vecellio et al.) finds that the actual limit is lower — about 31°C wet-bulb or 87°F at 100% humidity — even for young, healthy subjects. The temperature for older populations, who are more vulnerable to heat, is likely even lower. In practice the limit will typically be lower and depending on circumstances could be as low as a wet-bulb temperature of 25°C.


The above image shows a Wet Bulb Globe Temperature of 35°C (95°F) forecast for August 11, 2023, 19 UTC, for a location near Baton Rouge, Louisiana, U.S. 


Heat is the leading cause of weather-related deaths in the United States, as illustrated by the above image (credit: NOAA). Heat fatalities may be conservative figures. Recent research finds that where heat is being listed as an official cause of death, this likely underestimates the full toll of these events. Extreme heat can trigger heart attacks and strokes. In addition, some heart disease risk factors, such as diabetes—as well as heart medications, such as diuretics and beta blockers—can affect a person’s ability to regulate their body temperature and make it difficult to handle extreme heat. The study finds that extreme heat accounted for about 600-700 additional deaths from cardiovascular disease annually. A recent study estimates that extreme heat accounted for 12,000 premature deaths in the contiguous U.S. from 2000 to 2010, and a recent analysis calculates that the summer 2022 heatwave killed 61,000 people in Europe alone. 

The image below shows a temperature (°F) forecast for August 1, 2023, from Climate Reanalyzer


The video below discusses this.


Misery Index

The image below show a high reading on the 'Misery Index', the perceived ('feels like') temperature that is used by nullschool.net, combining wind chill and the heat index (which in turn combines air temperature and relative humidity, in shaded areas). A Misery Index temperature of 56.1°C or 133.1°F was recorded at a location off the coast of the United Arab Emirates (green circle) on August 5, 2023.


The temperature at that location at the time was 35.2°C or 95.4°F, lower than the temperature on the land surrounding the Gulf, but the relative humidity at that spot over the water was 78%, and that combination led to this very high 'feels like' temperature. 

This constitutes a warning. The sea, rivers and lakes are traditionally seen as places to go to, to cool off. However, high temperatures combined with high humidity over water bodies can result in conditions that go beyond what humans can bear. 

Climate change danger assessment

The image below, earlier discussed here, expands risk assessment beyond its typical definition as the product of the severity of impact and probability of occurrence, by adding a third dimension: timescale, in particular imminence.


Imminence alone could make that the danger constituted by rising temperatures needs to be acted upon immediately, comprehensively and effectively. While questions may remain regarding probability, severity and timescale of the dangers associated with climate change, the precautionary principle should prevail and this should prompt for action, i.e. comprehensive and effective action to reduce damage and improve the situation is imperative and must be taken as soon as possible.

Rapidly rising temperatures constitute tipping points in several ways 

Firstly, there is a biological threshold beyond which rising temperatures become lethal for humans, as discussed above. 

Secondly, as Gerardo Ceballos describes in the video below and in a 2017 analysis, there is a biological tipping point that threatens annihilation of species via the ongoing sixth mass extinction. Researchers such as Gerardo Ceballos (2020), Kevin Burke (2018) and Ignation Quintero (2013) have for years warned that mammals and vertebrates cannot keep up with the rapid rise in temperature. Humans are classified as vertebrate mammals, indicating that we will not avoid the fate of extinction, Guy McPherson (2020) adds. 

Thirdly, there are further tipping points, e.g. social-political ones. On the one hand, it would be good if people became more aware, as this could prompt more people into supporting the necessary action. On the other hand, as temperatures keep rising, there is also a danger that panic will break out, dictators will grab power and civilization as we know it will collapse abruptly, as warned about earlier, e.g. in 2007.  


Conclusion

In conclusion, to combat rising temperatures, transforming society is needed urgently, along the lines of this 2022 post in combination with declaration of a climate emergency.


Links

• Wet Bulb Globe Temperature
https://digital.mdl.nws.noaa.gov

• National Weather Service - Wet Bulb Globe Temperature: How and when to use it
https://www.weather.gov/news/211009-WBGT

• The emergence of heat and humidity too severe for human tolerance - by Colin Raymons et al. (2020)
https://www.science.org/doi/10.1126/sciadv.aaw1838

• Brief periods of dangerous humid heat arrive decades early
https://www.climate.gov/news-features/featured-images/brief-periods-dangerous-humid-heat-arrive-decades-early

• Evaluating the 35°C wet-bulb temperature adaptability threshold for young, healthy subjects (PSU HEAT Project) - by Daniel Vecellio et al. (2022)
https://journals.physiology.org/doi/full/10.1152/japplphysiol.00738.2021
Discussed at: https://www.facebook.com/groups/arcticnews/posts/10159973158374679

• NOAA - Weather Fatalities 2022
https://www.weather.gov/hazstat

• The Effects of Heat Exposure on Human Mortality Throughout the United States - by Drew Shindell (2021)
https://agupubs.onlinelibrary.wiley.com/doi/full/10.1029/2019GH000234

• Heat-related mortality in Europe during the summer of 2022 - by Joan Ballester et al.
https://www.nature.com/articles/s41591-023-02419-z
Discussed at: https://www.facebook.com/groups/arcticnews/posts/10160875637104679

• As Temperatures Spike, So Do Deaths from Heart Disease (2022 News release)
https://www.acc.org/About-ACC/Press-Releases/2022/03/22/20/06/As-Temperatures-Spike-So-Do-Deaths-from-Heart-Disease

• Association of Extreme Heat and Cardiovascular Mortality in the United States: A County-Level Longitudinal Analysis From 2008 to 2017 - by Sameed Khatana et al. (2022)
https://www.ahajournals.org/doi/10.1161/CIRCULATIONAHA.122.060746

• Co-extinctions annihilate planetary life during extreme environmental change, by Giovanni Strona and Corey Bradshaw (2018)
https://www.nature.com/articles/s41598-018-35068-1
Discussed at: https://www.facebook.com/groups/arcticnews/posts/10156903792219679

• When will we die?
https://arctic-news.blogspot.com/2019/06/when-will-we-die.html

• Climate Reanalyzer - Hourly Forecast Maps
https://climatereanalyzer.org/wx/fcst/?mdl_id=nam&dm_id=conus-lc&wm_id=t2

• PBS video - Too HOT and HUMID to Live: Extreme Wet Bulb Events are on the Rise 
https://www.pbs.org/video/too-hot-and-humid-to-live-extreme-wet-bulb-events-are-on-th-fazocs

• Nullschool
https://earth.nullschool.net

• How agriculture hastens species extinction | 60 Minutes (CBS News) | Gerardo Ceballos
https://www.youtube.com/watch?app=desktop&v=f21WWocqR-c

• Biological annihilation via the ongoing sixth mass extinction signaled by vertebrate population losses and declines - by Gerardo Ceballos, Paul R. Ehrlich and Rodolfo Dirzo (2017)
https://www.pnas.org/content/114/30/E6089

• Vertebrates on the brink as indicators of biological annihilation and the sixth mass extinction - by Gerardo Ceballos, Paul Ehrlich, and Peter Raven (2020)
https://www.pnas.org/content/early/2020/05/27/1922686117
Discussed at: https://www.facebook.com/groups/arcticnews/posts/10158460232764679

• Rates of projected climate change dramatically exceed past rates of climatic niche evolution among vertebrate species - by Ignatio Quintero et al. (2013) 

• Pliocene and Eocene provide best analogs for near-future climates - by Kevin Burke et al. (2018)
https://www.pnas.org/doi/10.1073/pnas.1809600115
Discussed at: https://www.facebook.com/groups/arcticnews/posts/10156972951354679

• Earth is in the Midst of Abrupt, Irreversible Climate Change - by Guy McPherson (2020)
https://www.onlinescientificresearch.com/articles/earth-is-in-the-midst-of-abrupt-irreversible-climate-change.pdf